Service
Dashboards people actually open
Platforms
Your tool, not ours
Excel
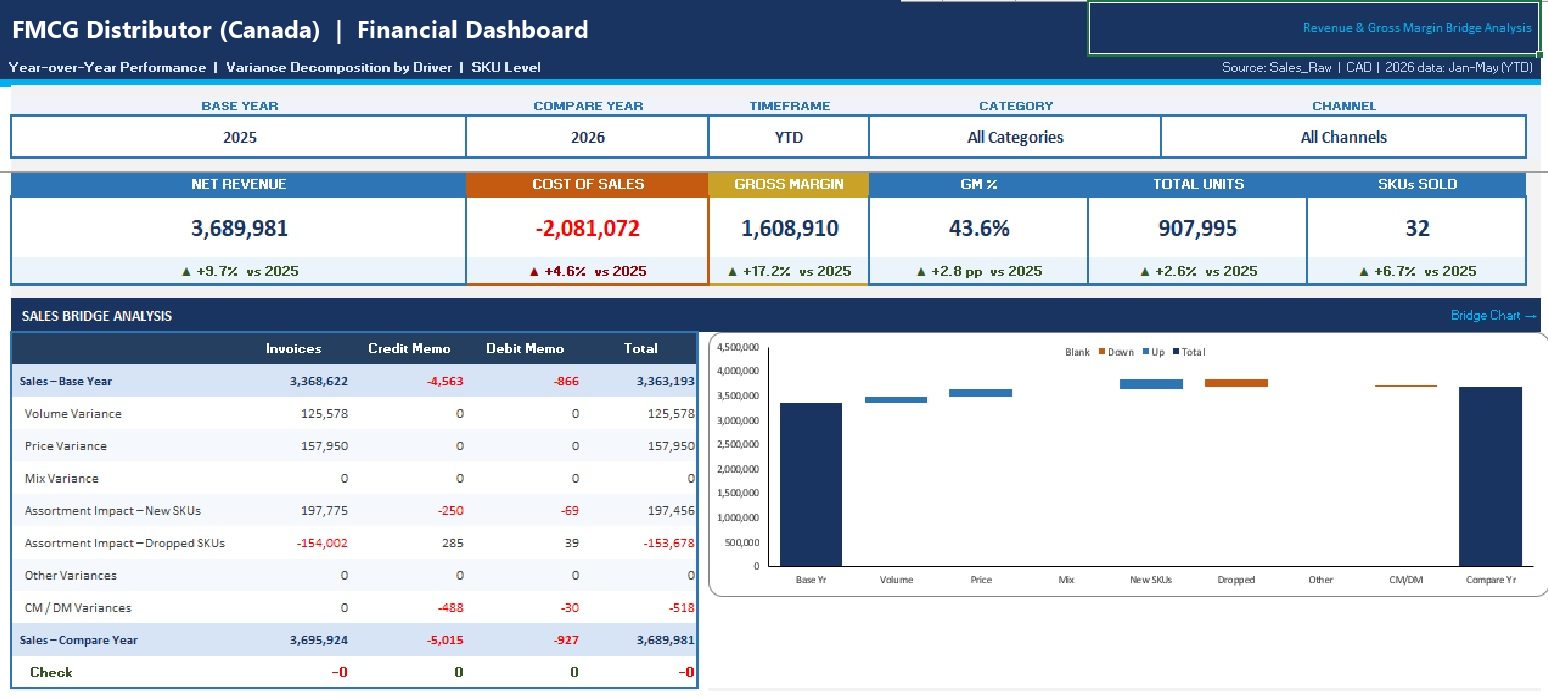
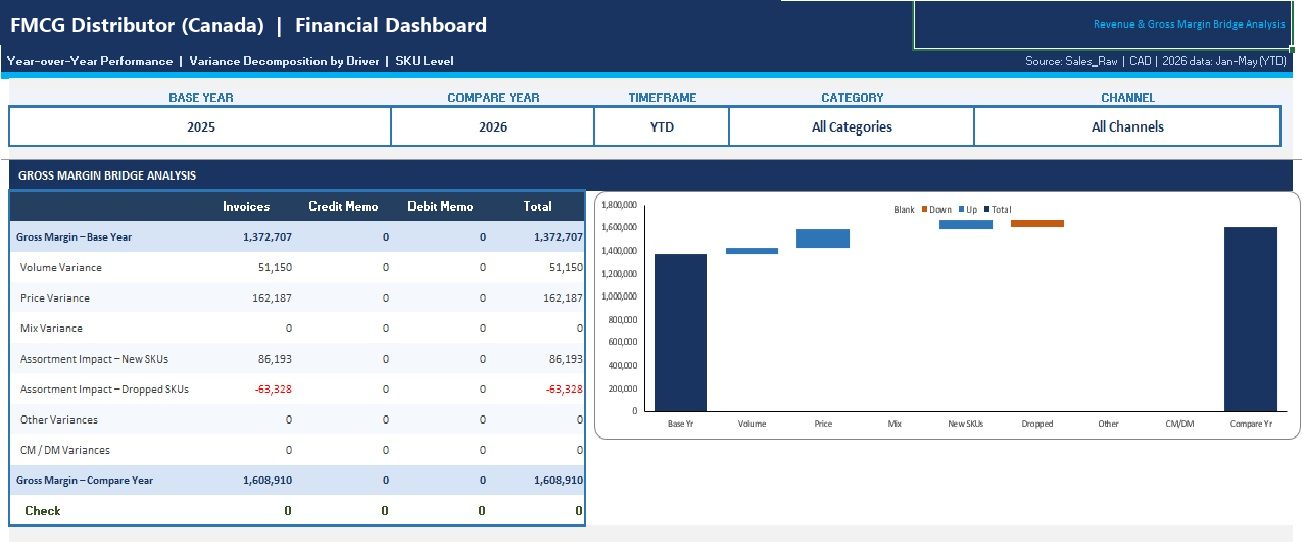
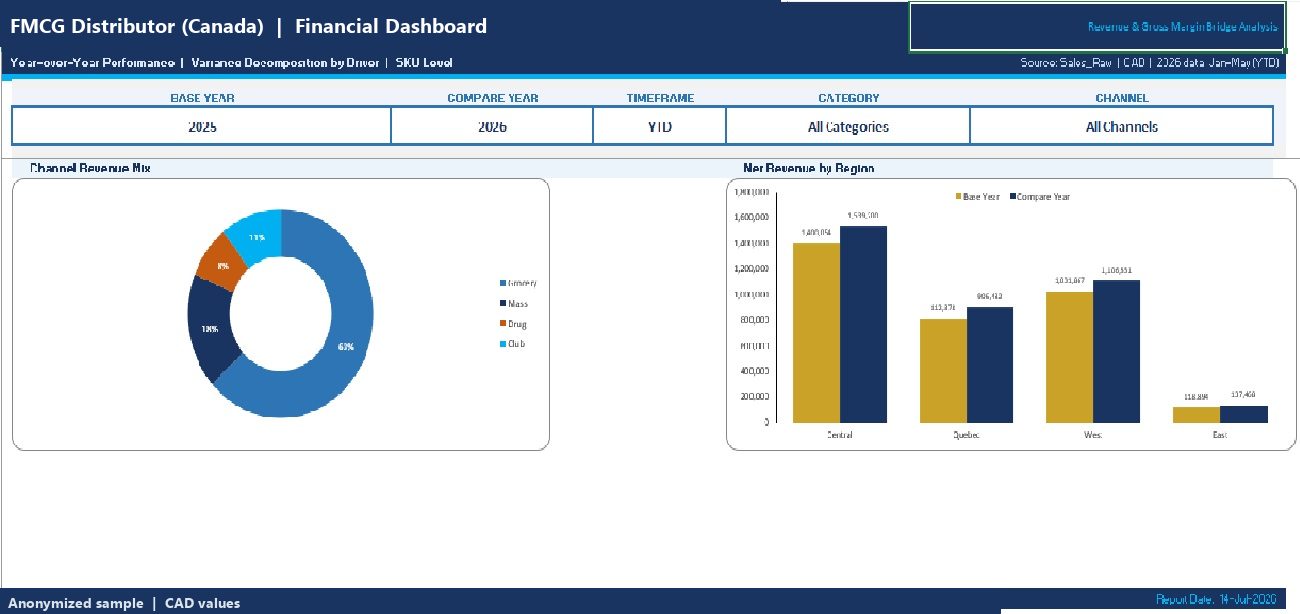
Interactive dashboards with slicers, dynamic charts and VBA automation where it earns its keep. Works everywhere your team already works.
Power BI
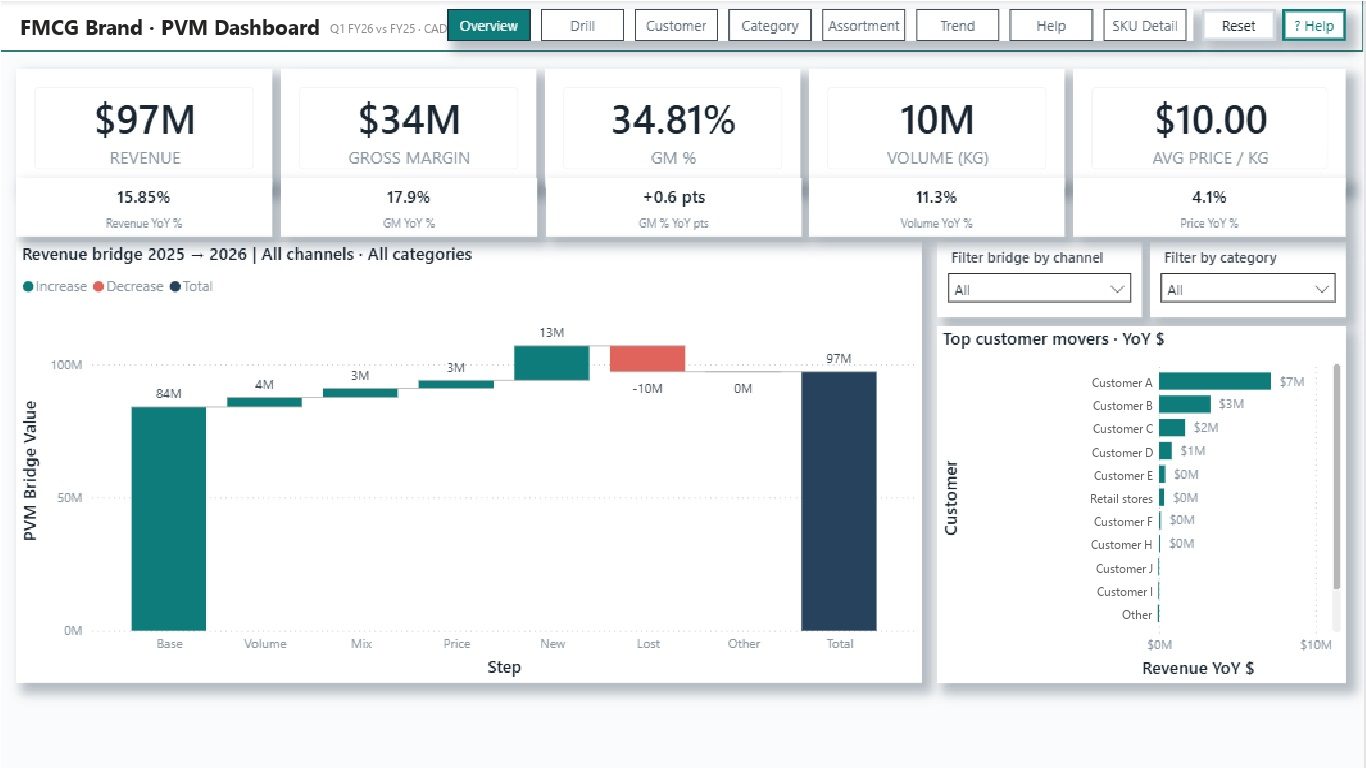
Drill-downs, scheduled refresh and row-level security for teams that need live, governed reporting.
Google Sheets
Shared, always-current dashboards for teams that live in Google Workspace.
- Financial dashboards — profit, cash, margins, variances
- Sales & marketing dashboards — pipeline, conversion, channel performance
- Operational dashboards — inventory, fulfilment, utilisation
- Automated data refresh so the numbers stay current without manual work
Gallery
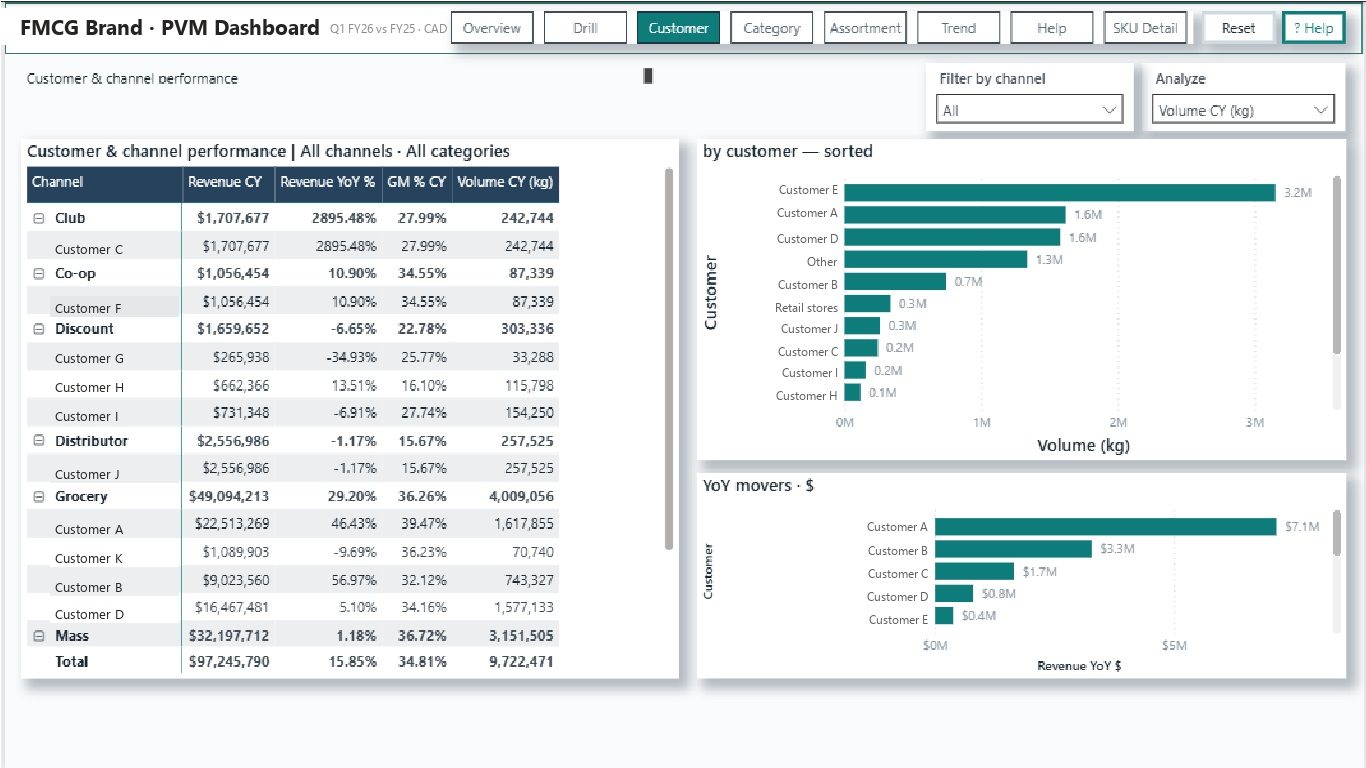
Recent dashboard work
Process
How an engagement runs
- 01
Understand
We start with your decision, not your data. What question must the numbers answer, and who needs to act on them.
- 02
Build
Structured to CFI/FMVA standards — documented assumptions, no hard-coded figures, formulas that trace back to sources.
- 03
Validate
Every output is checked against the inputs and stress-tested with scenarios before you ever see it.
- 04
Deliver
A clean handover with a walkthrough, one round of refinements, and files your team can maintain.
Questions
Frequently asked
Which tool should I pick — Excel, Power BI or Google Sheets?
Whichever your team will actually open. We advise on the trade-offs during the first call: Excel for portability, Power BI for live governed reporting, Sheets for Google-first teams.
Can you automate the data refresh?
Yes. Power BI and Sheets can refresh on schedule; Excel dashboards can be automated with VBA or Power Query depending on your setup.
Can you rebuild or fix an existing dashboard?
Yes — rebuilds of slow, fragile or inherited dashboards are common work. We keep what works and fix what does not.
What does a dashboard cost?
It depends on data sources and complexity, so we quote per project — a fixed number before work starts, after a short scoping call.
Free template
Not ready to talk? Try one yourself.
Get our free one-page business dashboard — plug in your numbers and see profit, margins, cash and a full P&L on one page. The same standard we build for clients.
Ready to see your numbers clearly?
Tell us what you need — get a clear plan and a fixed quote within one business day.